
In any solar plant or solar panel in rooftop installation, understanding the movement of the sun across the sky is fundamental. A properly interpreted sun path diagram helps installers determine the optimal angle of inclination (tilt angle) for maximum solar electricity generation.
This explains how a sun path diagram is created for a specific location and time, and how it is used to estimate the ideal tilt angle, ultimately influencing solar energy installation cost efficiency and long-term solar panel system cost recovery.
What is a Sun Path Diagram?
A sun path diagram is a graphical representation of the sun’s apparent movement across the sky dome for a specific location over a defined period (daily, monthly, or yearly).
It shows:
- Solar altitude angle (vertical angle from horizon)
- Solar azimuth angle (direction relative to north)
- Seasonal variation (summer, equinox, winter)
- Sunrise and sunset positions
It is location-specific because solar angles vary with latitude.
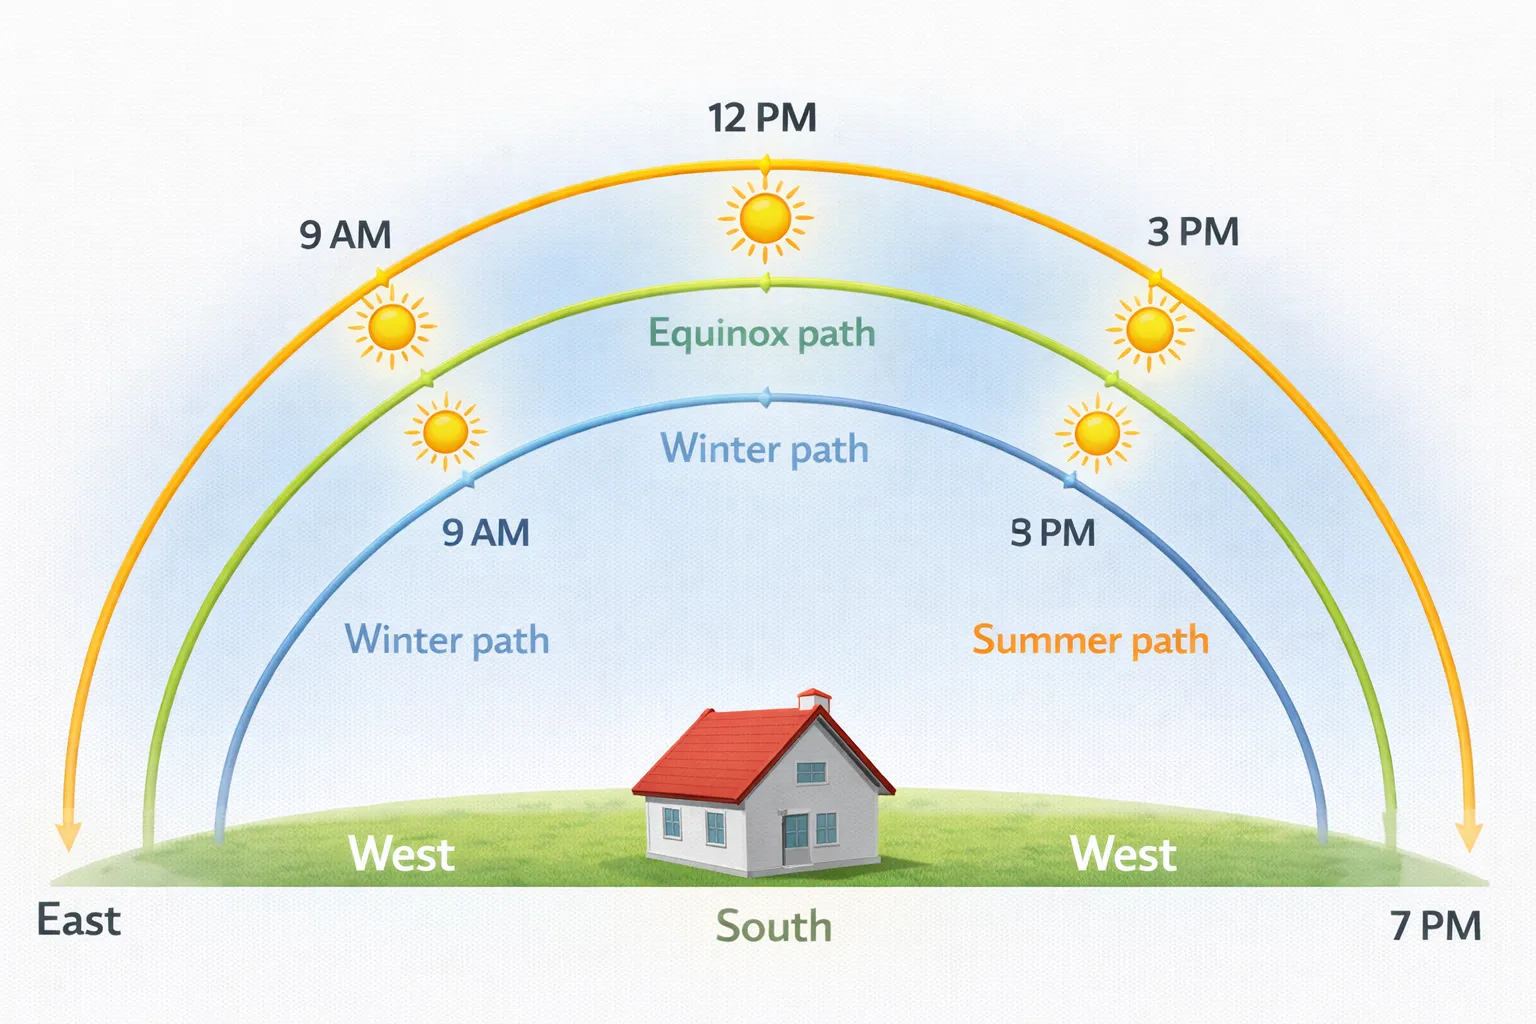
Components of a Sun Path Diagram
A. Solar Altitude (Elevation Angle)
Angle between the sun and the horizontal plane.
Higher altitude → More perpendicular solar radiation → Better solar energy absorption.
B. Solar Azimuth
Horizontal direction of the sun measured from true north.
In India:
- South-facing panels maximize annual solar electricity output.
C. Declination Lines
Curved paths representing:
- Summer solstice
- Winter solstice
- Equinox
These lines help in determining seasonal solar plant performance.
Example: Sun Path Diagram for Delhi (Latitude ~28°N)
Let’s understand using a practical example relevant for solar energy for home use.
Step 1: Identify Location Latitude
Delhi ≈ 28°N
Step 2: Observe Sun Path on Key Dates
- Summer Solstice (June 21) → High solar altitude
- Winter Solstice (December 21) → Low solar altitude
- Equinox (March/September) → Moderate altitude
Step 3: Note Noon Solar Altitude
Solar altitude at solar noon can be calculated using:
> Solar Altitude = 90° – |Latitude – Declination|
For equinox: Declination = 0°
Altitude = 90° – 28°
Altitude = 62°
This value helps determine panel tilt optimization.
Using Sun Path Diagram to Estimate Angle of Inclination
The angle of inclination (tilt angle) is chosen to:
- Maximize annual energy yield
- Reduce solar installation cost per kWh
- Improve smart solar panel price positioning
- Lower total cost of solar installation over system life
Method 1: Annual Optimization
Rule of Thumb:
> Optimal Tilt ≈ Local Latitude
For Delhi: Tilt ≈ 25–30°
This balances summer and winter production.
Method 2: Seasonal Optimization
From sun path diagram:
- Winter-focused systems → Increase tilt by 10–15°
- Summer-focused systems → Decrease tilt by 10°
Used in:
- Commercial solar plant projects
- Agricultural solar systems
Practical Application for Solar Installers
During Rooftop Survey:
Installers should:
- Observe shadow obstacles
- Compare rooftop direction with sun path azimuth
- Ensure no shading between 10 AM – 3 PM
- Confirm mounting structure can support recommended tilt
Incorrect tilt leads to:
- Reduced solar electricity generation
- Increased average cost of solar panels on a house (per unit output)
- Poor performance under subsidised solar panels for home programs
How Sun Path Analysis Impacts Solar Installation Cost
Better inclination angle:
- Maximizes kWh generation
- Reduces cost of solar per kWh installed
- Improves payback period
- Enhances efficiency under government solar subsidy scheme projects
Improper analysis increases:
- Solar installation charges due to redesign
- Solar energy installation cost inefficiencies
- Long-term maintenance issues
Safety Considerations During Tilt Implementation
- Verify wind load impact at higher tilt angles
- Use certified mounting structures
- Ensure proper anchoring on rooftop
- Maintain safe working practices during adjustment
Safety compliance supports renewable energy technology sustainability.
Conclusion
A sun path diagram is not just a theoretical concept, it is a practical design tool that directly influences solar plant performance, solar panel system cost efficiency, and long-term solar energy installation cost optimization.
By accurately interpreting sun path diagrams for specific locations and time periods, installers can determine the ideal angle of inclination, reduce solar installation charges caused by inefficiencies, and optimize cost of solar per kWh installed.
Ultimately, correct sun path analysis makes solar energy more economical, strengthens smart solar panel price competitiveness, and enhances the performance of solar energy for home use and large-scale solar plant systems alike.
FAQs
Q1. Why is a sun path diagram important in solar panel in rooftop installations?
Ans: It helps installers determine the best tilt and orientation to maximize solar electricity output.
Q2. Does sun path analysis reduce solar installation cost per kWh?
Ans: Yes. Proper angle optimization increases energy generation, lowering cost per unit.
Q3. Is the tilt angle same across India?
Ans: No. It varies based on latitude. For example, southern India requires lower tilt compared to northern regions.
Q4. How does sun path diagram affect solar energy for home use?
Ans: It ensures panels receive maximum sunlight, improving system efficiency and reducing home roof solar panels cost over time.
Q5. Is sun path analysis necessary under government solar subsidy scheme?
Ans: Yes. Proper design ensures system performance standards are met, especially for subsidised solar panels for home projects.

India’s Solar Capacity Growth Slows Down in Q1 2023
India’s solar capacity growth slowed in Q1 2023. Explore the factors behind the slowdown and its impact on the country’s renewable energy progress.

Haryana Electricity Tariff Hike Impacts All Consumer Categories in 2015-16
Haryana electricity tariffs were increased across all consumer categories in 2015-16, raising power costs for households, industries, and businesses statewide.

Solar PPA for Commercial Buildings: Cost, Benefits & Savings
Looking to cut electricity bills without investing in solar assets? Commercial Solar PPA providers offer zero-investment solar solutions where businesses pay only for the power generated—simple, risk-free, and cost-effective.

Law Change Makes It Hard to Receive Compensation for Solar Developers
A recent law change creates hurdles for solar developers seeking compensation, impacting project viability.
Are Colleges and Schools ready to take up Solar challenge?
Adopting solar energy can help schools and colleges reduce electricity costs and promote sustainability. This guide explores how educational institutions can implement rooftop solar projects, the benefits, and what steps are needed to take on the solar challenge effectively.

How MPPT Works in an Inverter: A Simple Guide for Solar Users
This simple guide explains how MPPT works in a solar inverter, helping users understand how it maximizes power output and improves system efficiency.

Perovskite: Future of Solar Cells
Discover how solar batteries store excess energy, maximize your solar system’s efficiency, and provide reliable power during outages. Learn about the types, benefits, lifespan, and maintenance tips to make the most of your solar investment.

Everything you Need to Know about Bifacial Solar Panels technology
Learn how bifacial solar panels capture sunlight on both sides, boosting energy efficiency and maximizing solar power generation for homes and businesses.