Solar Net Metering in Industrial Units: Opportunities and Risks
Discoms in almost all the states provide Solar Net Metering facility by which the consumers can store the excess energy generated from the roof top solar plant with the Discom Grid and can use it in later hours.
During the Sun hours, when the load (in KW) of the factory or the commercial building is less than the roof top solar generation for any 15-minute block interval, the excess solar energy goes back to the Grid. During evening hours when the load is more and there is hardly any solar generation, then the stored solar energy is used back by the consumer from the Grid.
Steps of accounting of the roof top solar energy (Solar Net Metering)
The accounting of the roof top solar energy is done on a monthly basis.
- At the end of each month, the solar energy is set off against the energy consumed by the factory or the Plant through a bi-directional meter installed by the Discom at the Consumer premises.
- If there is any excess solar energy which is not used during the month, it is taken forward to the next month in which the consumer can use the same.
- However, if there is unused solar energy left in March (end of Financial Year), then it will lapse as per the policy in Haryana while it will be paid at Rs 2.0 /kWh in Uttar Pradesh. Similar policies exist in other states also including Delhi, Rajasthan and Punjab.
The table below shows the energy accounting and settlement for 1 month (April) under Solar Net Metering for a 100 KW solar system in a typical factory set up with a contract demand of 100 KW.
| Day | Energy Consumed(kWh) | Solar Generation)(kWh) | Banked Energy |
| 1 | 614 | 479 | – |
| 2 | 15 | 478 | 463 |
| 3 | 478 | 491 | 13 |
| 4 | 645 | 444 | – |
| 5 | 633 | 450 | – |
| 6 | 701 | 441 | – |
| 7 | 612 | 520 | – |
| 8 | 426 | 523 | 97 |
| 9 | 12 | 541 | 529 |
| 10 | 459 | 497 | 38 |
| 11 | 723 | 478 | – |
| 12 | 578 | 483 | – |
| 13 | 623 | 429 | – |
| 14 | 701 | 501 | – |
| 15 | 641 | 504 | – |
| 16 | 12 | 502 | 490 |
| 17 | 423 | 476 | 53 |
| 18 | 530 | 472 | – |
| 19 | 481 | 451 | – |
| 20 | 392 | 439 | 47 |
| 21 | 543 | 472 | – |
| 22 | 605 | 462 | – |
| 23 | 12 | 495 | 483 |
| 24 | 452 | 523 | 71 |
| 25 | 545 | 547 | 2 |
| 26 | 393 | 482 | 89 |
| 27 | 479 | 477 | – |
| 28 | 625 | 461 | – |
| 29 | 521 | 441 | – |
| 30 | 12 | 478 | 466 |
| April | 13,886 | 14,437 | 551 |
For certain days in April month, the energy is getting banked or stored with the Discom. At the end of month, solar has generated excess of 551 kWh or units which will be taken forward to the month of May.
Table below shows monthly settlements for the full year of solar energy.
| Month | Energy Consumed(kWh) – (1) | Solar Generation)(kWh) – (2) | (2)-(1) (kWh) | (Cumulative Energy banked (kWh) |
| Apr | 13,886 | 14,437 | 551 | 551 |
| May | 15,672 | 15,432 | (240) | 311 |
| Jun | 14,521 | 13,441 | (1,080) | – |
| July | 12,673 | 11,699 | (974) | – |
| Aug | 11,128 | 10,952 | (176) | – |
| Sep | 11,893 | 11,699 | (194) | – |
| Oct | 12,321 | 11,450 | (871) | – |
| Nov | 11,009 | 9,210 | (1,799) | – |
| Dec | 10,121 | 8,463 | (1,658) | – |
| Jan | 10,344 | 8,712 | (1,632) | – |
| Feb | 11,236 | 11,201 | (35) | – |
| Mar | 11,037 | 13,690 | 2,653 | 2,653 |
So, there is excess solar generation in the months of April and March. However, the excess generation of April month is utilized in future months during the settlement year. But the excess solar generation in month of March will lapse in spite of solar Net Metering facility.
Especially for seasonal industries that has lean period during winter months, the coincidence of the settlement year with the financial year is a problem. For example, the potato cold storages (aloo godowns) has this typical problem as they hit a off season from October to February when their load dips significantly.
Suggested Articles

Should You Replace Solar Panels with Solar Shingles?
Discover how solar batteries store excess energy, maximize your solar system’s efficiency, and provide reliable power during outages. Learn about the types, benefits, lifespan, and maintenance tips to make the most of your solar investment.

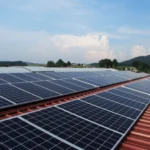
100 kW Solar Plant Cost in Rajasthan: Latest Cost, Maintenance & Payback Time
Installing a 100 kW solar plant in Rajasthan costs around ₹40–60 lakh in, with annual savings up to ₹10–12 lakh. Discover maintenance needs, ROI, and payback period of 4–6 years.

Latest MNRE List: Approved Solar Module Manufacturers
Check the latest MNRE-approved list of solar module manufacturers to ensure quality and compliance for your solar projects in India.

Net Metering and Its Advantages Explained: How Solar Users Save More on Energy Bills
Learn what Net Metering and its advantages mean for you—cut electricity costs, earn energy credits, and boost solar efficiency easily.

500 kW Solar System Price in Indore: Complete Industrial Guide
Planning to install a 500 kW solar power plant in Indore? Discover the complete cost details, government subsidy options, and potential savings for industries in 2025.

Haryana and UP Face Delays in Solar Net Metering Approvals
Net metering for rooftop solar in Haryana and Uttar Pradesh faces procedural delays, affecting solar adoption and efficiency for residential and commercial consumers

पीएम सूर्य घर योजना 2025 – मुफ्त बिजली पाने के लिए ऐसे करें आवेदन
पीएम सूर्य घर योजना ऑनलाइन आवेदन 2025: मुफ्त बिजली पाने की आसान स्टेप-बाय-स्टेप प्रक्रिया यहाँ पढ़ें।

Top 10 Sustainable Building Practices to Consider for Your Construction Business
The construction industry is embracing sustainability like never before. From smart design to renewable energy use, these top 10 practices ensure businesses stay competitive, compliant, and environmentally responsible.