Battery Bank Installation in Solar Projects: Site Selection & Best Practices
Battery banks are essential for energy storage in solar projects. This guide explains site selection, installation procedures, safety measures, and best practices for solar battery systems.

What Is Renewable Energy? What Is the Best Source of Renewable Energy and Why? – Complete Guide
Renewable energy comes from natural sources like sunlight, wind, water, and biomass that are constantly replenished. As India accelerates its transition toward clean energy, understanding different renewable energy sources and identifying the most efficient and cost-effective option is crucial. This complete guide explains renewable energy types, their advantages, and compares them to determine the best source based on sustainability, scalability, and long-term benefits.

Affordable Solar Systems and Plants for Small and Medium Enterprises
Learn how SMEs can harness solar energy through tailored solar systems and plants to reduce electricity bills, improve sustainability, and boost efficiency.

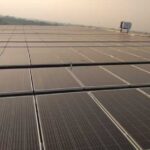
Solar PV Module Damage Inspection & Quality Checks in Solar EPC
A practical solar panel unpacking guide covering safe handling, on-site precautions, and key do’s and don’ts to avoid module damage.
PV System Maintenance Tools & Equipment Guide
A complete guide to performing the solar PV anti-islanding test, ensuring safe grid-connected operation, regulatory compliance, and reliable inverter performance.

Difference Between Single-Phase and Three-Phase Voltage and Its Use for Solar PV Installer – Complete Guide
Understanding the difference between single-phase and three-phase voltage is essential for solar PV installers. While single-phase supply is common in residential systems, three-phase power is widely used in commercial and industrial solar projects. This complete guide explains electrical phase differences, applications in solar installations, and how choosing the right phase connection impacts system efficiency, safety, and performance.
Photovoltaic Power Output Explained: A Practical Guide for Homes & Businesses
Photovoltaic power output determines how much electricity a solar system can generate. This simple guide explains PV output, how it is calculated, and what it means for homes and businesses planning to go solar.
Generation Based Incentive Proposed for Rooftop Solar in Haryana
Haryana plans to offer Generation Based Incentive (GBI) for rooftop solar installations, promoting clean energy adoption and reducing electricity costs for consumers.