
Higher Electricity Bills in Haryana as Fuel Surcharge Rises
Haryana consumers are facing higher electricity bills after the Haryana Electricity Regulatory Commission (HERC) approved a fuel surcharge hike for DHBVN and UHBVN areas. The increase reflects rising fuel and power purchase costs, directly impacting domestic, commercial, and industrial users across the state.

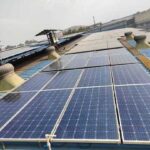
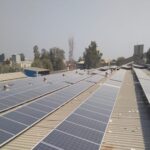
Solar Installation Cost in Haryana: Pricing, Savings & Subsidy Guide
Solar installation cost in Haryana varies by system size, components, and subsidy eligibility. This guide explains per-kW pricing, government incentives, and how much owners can save with rooftop solar in 2025, helping you choose the right system at the right budget.

6 Innovative Applications of Solar Energy You Should Know About
Explore how solar energy is revolutionizing daily life and industries. From solar-powered transport to smart cities, discover six groundbreaking solar applications shaping a cleaner, smarter future.
Solar Panel Sizes and Features in Delhi/NCR: A Complete Guide
Planning to install solar panels in Delhi/NCR? Explore the different sizes, technologies, and key features of solar panels available for residential, industrial, and commercial use. Learn how to choose the right one for your energy needs and roof space.

Haryana’s GEOA 2025: A Boost for Captive Solar Plants and Wind Energy Developers
Haryana’s GEOA 2025 paves the way for growth in captive wind and solar energy projects with investor-friendly reforms.

SmartRoof Solar Associate Program – Easy Way to Earn with Solar Referrals
Join the SmartRoof Solar Associate Program. Refer solar leads, earn rewards, and support clean energy growth in your community.

Researchers Propose New Way to Make Nuclear Power Plants Safer
Researchers propose innovative methods to enhance the safety of nuclear power plants, aiming to reduce risks and improve operational security.
Why Go Solar: A Complete Guide to Solar Power for Homes and Industries
Switching to solar energy offers significant savings and environmental benefits. This guide explains why going solar is a smart choice, covering financial incentives, reduced electricity bills, and positive impacts on the planet.