
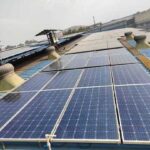
Solar Installation on Sloped Roofs: Design, Mounting Systems & Best Practices
A practical guide to flat roof solar installation covering key design considerations, mounting system types, and best practices for efficient and reliable performance.
Solar PV AC or DC: How Solar Electricity Is Generated
Total solar PV power represents the combined power output of a solar photovoltaic system. This guide explains its meaning, calculation, and how it directly impacts solar performance, efficiency, and long-term energy generation.

Role of PV Solar Installer in India – Responsibilities, Skills, and Industry Importance
PV solar installers play a critical role in India’s rapidly expanding solar energy sector. From rooftop systems to large-scale industrial projects, skilled installers ensure safe, efficient, and compliant solar plant deployment. This guide explains the responsibilities, technical skills, certifications, and career opportunities for PV solar installers in India, along with their growing importance in supporting the nation’s renewable energy transition.
How the RESCO Model Works in Solar: A Complete Guide for Industries
The RESCO model allows businesses to adopt solar with zero upfront investment. Under this model, a developer installs, owns, and operates the solar plant while you simply pay for the power you consume—making clean energy both affordable and hassle-free.
How to Calculate Savings from Rooftop Solar Solutions: A Complete Guide
Calculating savings from rooftop solar solutions is essential for planning your investment. This guide explains how to estimate cost reduction, return on investment, and long-term financial benefits for residential, commercial, and industrial solar projects.
Delhi Government Pledges to Boost Renewable Energy Generation
Delhi, the capital city of India, is moving towards a greener future with an ambitious plan to generate an additional 6,000 MW of electricity using renewable energy sources.

100 kW Solar Power Plant Cost in Haryana: The Ultimate Guide to the Best Rate Per Watt
Explore the 100 kW solar power plant cost in Haryana for 2025. Learn about pricing, government subsidy options, and how much you can save with solar energy.
Safe Handling of Solar PV Components: Complete Guide for EPC & Installers
Proper material handling is crucial in solar PV projects to avoid damage, reduce losses, and ensure safety. This guide covers best practices for transporting, storing, and installing solar components efficiently.