
Everything You Should Know About Solar Batteries
Discover how solar batteries store excess energy, maximize your solar system’s efficiency, and provide reliable power during outages. Learn about the types, benefits, lifespan, and maintenance tips to make the most of your solar investment.
Capex vs Opex Solar Model: Which is Better for Your Energy Needs?
Solar energy systems are becoming increasingly popular in homes and businesses around the world. With rising electricity costs, solar energy provides an attractive alternative to traditional energy sources.
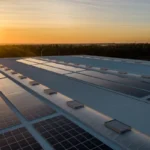
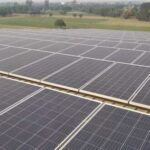
Complete Guide to Rooftop Solar Components for Industries
A rooftop solar system for factories typically includes solar panels, inverters, mounting structures, wiring, and monitoring systems. Additional components like net meters and energy storage may also be installed to optimize energy usage and track performance

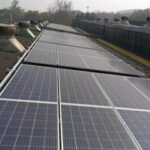
100 kW Solar Power Plant Cost in Haryana: The Ultimate Guide to the Best Rate Per Watt
Explore the 100 kW solar power plant cost in Haryana for 2025. Learn about pricing, government subsidy options, and how much you can save with solar energy.
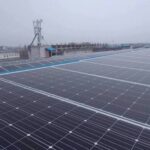
Stop Losing Power: The Ultimate Guide to Solar DC & AC Cable Sizing for Max Efficiency
DC and AC cabling are the lifelines of any Solar PV Rooftop System. Learn how proper cable selection, connection design, and installation can help achieve optimum power output and long-term safety.
How Azimuth Angle Impacts Solar Panel Efficiency for Homes, Industries, and Commercial Buildings
Discover how solar panel azimuth impacts energy generation in homes, industries, and commercial buildings. Maximize efficiency with correct orientation.
India Raises Solar Purchase Obligation (SPO) to 8%: A Complete Guide
The Solar Purchase Obligation (SPO) in India is set to increase to 8%, pushing companies to adopt more solar energy. This guide explains the implications for businesses, compliance strategies, and how organizations can align with renewable energy targets.
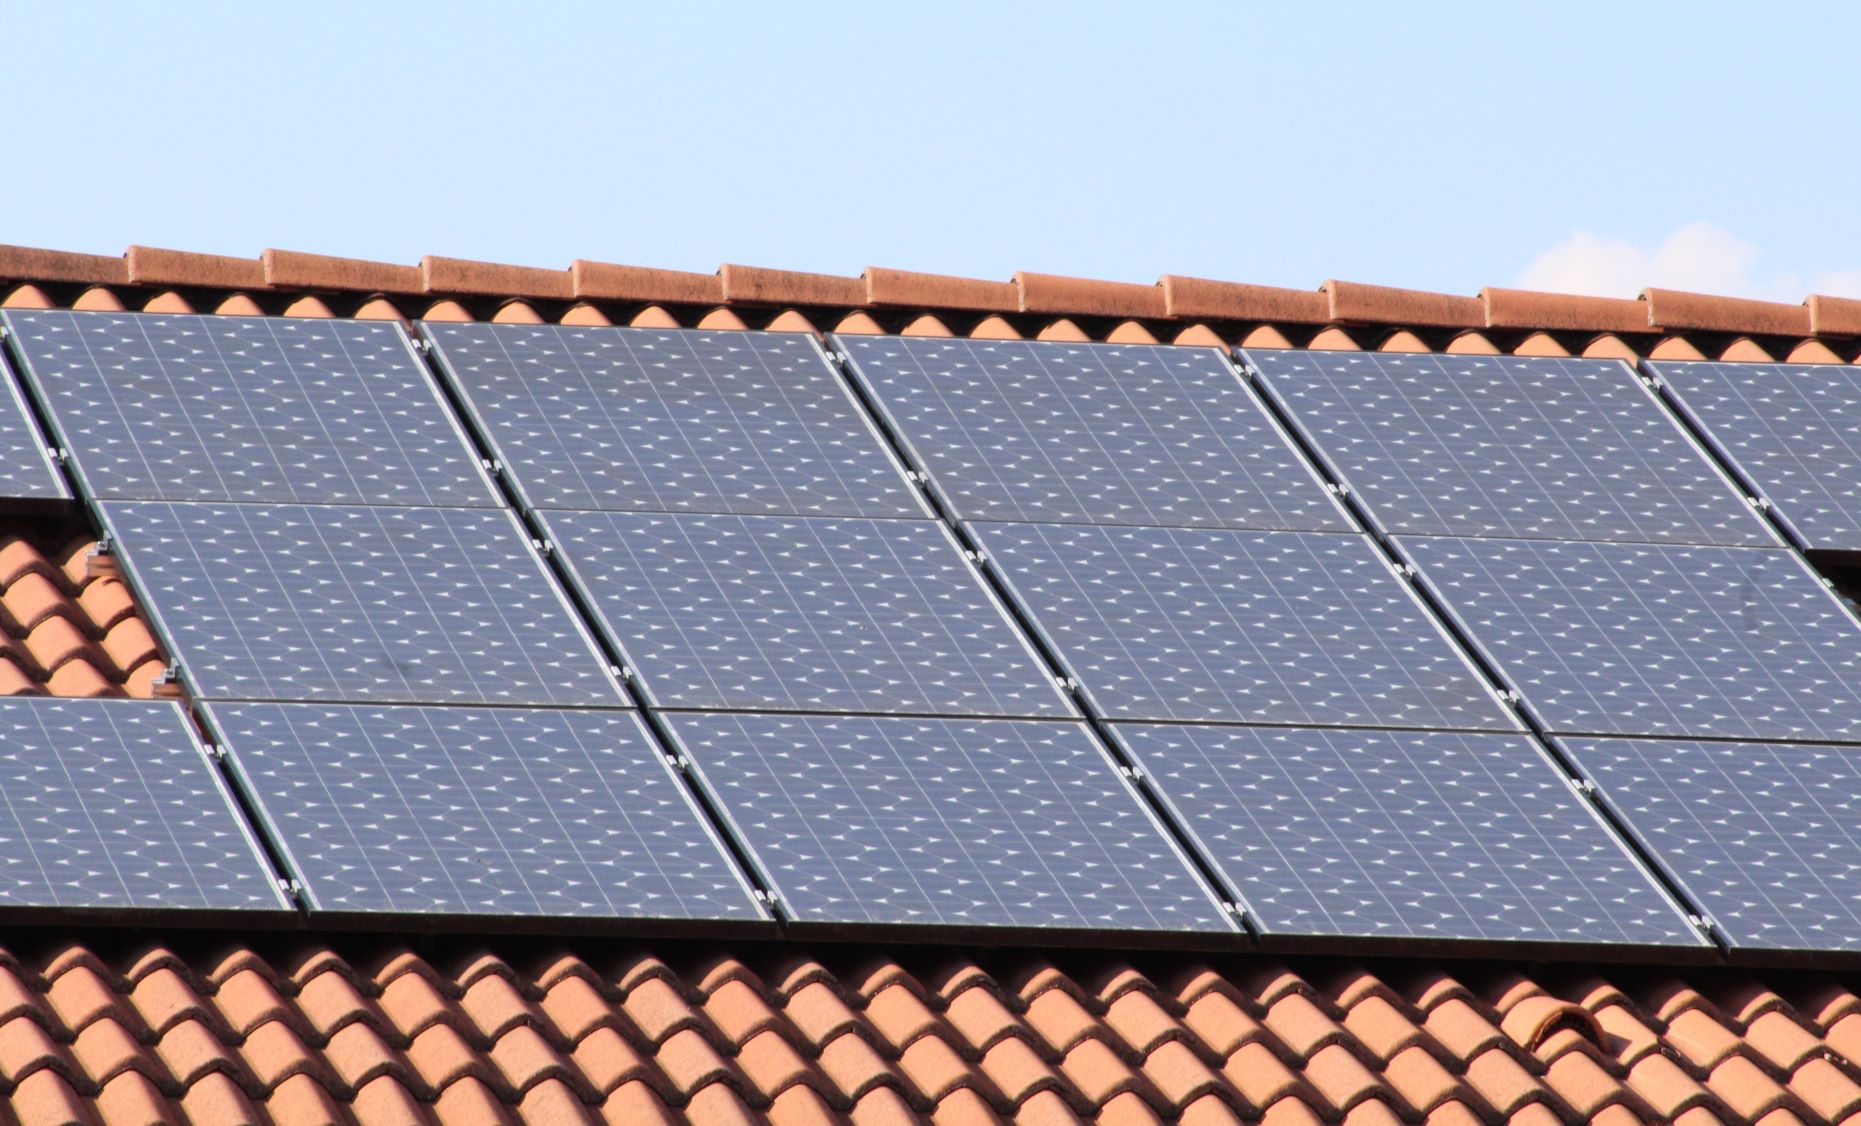
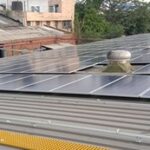
Solar Panel Installation on Tiled Roofs: Complete Homeowner Guide
When you’re ready to install solar panels on your home, there are many factors that will determine the unique design and cost of your solar system. Various roof types require different processes for installation. For example, lightweight tile roofs can present unique challenges and considerations for a solar installer. Here are a few things you need to know before adding solar energy to your tile roof.